See Productivity in Real Time.
Monitor employee activity, track work hours, and improve team efficiency with powerful insights.
Dashboard reporting is a platform where collected key performance indicators can be displayed all information in a single view. Instead of checking big spreadsheets and multipage documents you can use a dashboard reporting system for checking real time data trends through charts, progress bars, maps and summaries.
The main purpose of dashboard reporting is converting raw data into clear visual information. It relates to databases and customer software and converts into easy-to-understand reports and with the help of central view, managers, employees and team leaders can understand performance quickly without manual data entry.
What is the Purpose of Dashboard Reporting?
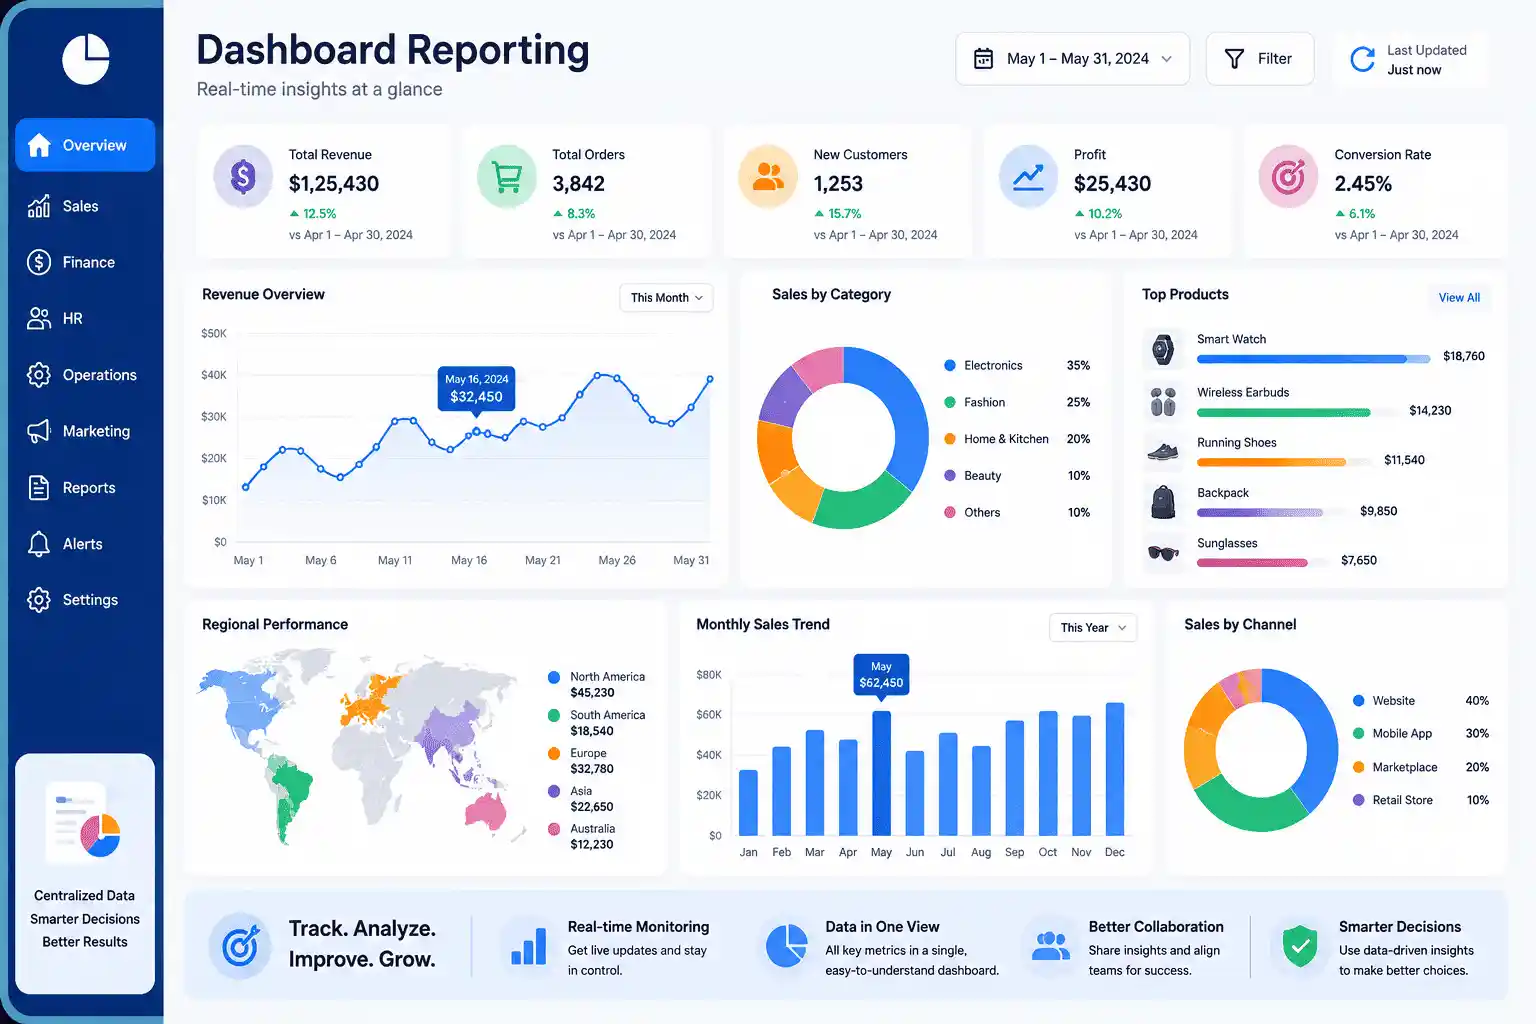
It converts raw data into actionable insights so that employers can make better decisions and here are some reasons why companies use dashboard reporting
Monitor daily business activity in organization
It helps to understand daily activities of employees, sales figures and events of operations
Identify performance trends
You can easily find patterns over time like seasonal change in revenue and changes in customer retention
Improve transparency
Because dashboard reporting is platform where management and employees can see their own performances, sales targets, business growth rate so it reduces confusion about meeting targets
Take decisions quickly
After dashboard reporting manager is not waiting for reporting at month-end because manager can see any employee performance 24*7 and make decisions when problems are found.
Example of Dashboard Reporting?
Let us take a common example of dashboard reporting is employee performance management
- Track productivity
You can monitor how employees complete their tasks during working hours
- Monitor attendance
Easily track employees for late arrival and absences
- Measure task completion
How many tasks employees complete during work
- Track performance goals
Monitor employee progress toward team and individual goals
- Identify employee performance issues
It helps to identify performance issues easily where employees need support and training
What are the Types of Dashboards?
Different teams require different levels of detailed reports and dashboard reporting are generally divided into three main categories
- Operational Dashboard – This dashboard focuses on short term daily operations and dashboard provides real-time alerts to the management like HR teams or manager so that they can take quick action
Focus – Current status, daily targets and instant alerts
Users – Help desk teams, inventory managers and customer support agents
- Analytical Dashboards – This dashboard focuses on historical data analysis, trend and cause and effect patterns and this data will help in past performance evaluation and make better decisions in future
Focus – Monthly basis trends, comparison models and deep data filtering
Users – Business analysts, marketing strategists and financial planners
- Strategic Dashboard – This dashboard provides a view of overall business health and long-term organizational goals
Focus – High level KPIs, quarterly earnings and overall departmental performance
Users – Executives, directors, department heads and board members
What is the Difference Between a Dashboard and a Report?
Users generally understand dashboards and reports are the same, but this is not true because both are used for different purposes
| Feature | Dashboard | Traditional Report |
|---|---|---|
| Primary Format | Highly visual | Text-heavy summaries |
| Data Updates | Live & real time alerts | Fixed snapshot of a past period |
| Level of Detail | High-level overview | Line-by-line detailed information |
| User Interaction | Interactive filters | Sequential reading |
| Core Goal | Quick monitoring | Formal record keeping |
Why is Dashboard Reporting Important?
Dashboard reporting plays an important role in modern organizations because raw data looks confusing for managers and employees. Dashboard reporting system reduces confusion and converts raw data into insights
Eliminate manual work
With the help of automated system, managers has no need to create spreadsheets manually and save working hours
Promote data driven decision making
Decision is not taken on the basis of guesswork, decisions are made on verified metrics and trends
Break down information
Connect multiple software through one central view get all department information from one source
Highlight bottlenecks
Visual alerts help teams to identify performance issues early before small problems become major operational problems.
How is Dashboard Reporting Used in HR?
Here are some common HR dashboard reporting applications which is useful for HR teams
Recruitment and Hiring
HR can track candidate hiring status, estimated cost per hire and how many company jobs have
Retention and Turnover
Monitor employee retention rates like what is the ratio of retain employees, voluntary departure trends and employee tenure
Absence and Leave Management
HR teams can manage easily like who is present or absent today, employee leave balance status and HR can approve and reject leave request through dashboard
Training and Development
Measure completion rates of training programs and mandatory development programs which is useful for employees
What Should an Employee Dashboard Include?
A simple dashboard reporting can be designed for employees and managers so that they can review performance. A comprehensive employee dashboard includes this information
- Details of employee current roles and responsibilities, name and manager contact details
- Time and attendance tracker for remaining vacation days and sick leave usage
- Training module for checking assigned learning program status and upcoming project renewal deadlines
- Direct links for recent payments, enrollment and benefits status and tax documents
How Do You Create a Reporting Dashboard?
- Define your audience and goals
- Select key performance indicators
- Connect data sources
- Design for visual clarity for charts and graphs
- Keep layout simple and clean so everyone can understand easily
- Test and refine before implementation in the company
What Tools Are Used for Dashboard Reporting?
For tracking employee productivity, time tracking, attendance tracking, screenshot monitoring, generating employee performance reports in Excel, application usage and user activity during working hours.
Turn Your Work Data Into Clear Insights With WorkDesQ
Microsoft Power BI
This is best for using deep data integration, custom data modeling and detailed interactive visual reports
Looker Studio (Google)
This is a free tool which can provide full information of website traffic like target audience, clicks, audience location, top performing pages, low-performing pages and many more.
Spreadsheet application
Basic charts, pivot tables and simple, accessible, entry-level options for manual dashboard
Conclusion
Dashboard reporting is an effective way to convert raw to useful information. With this employee and manager can see productivity score, attendance, task completion, performance goals and other important factors.
The main benefit of dashboard reporting is that they do not want to wait for months because it shows real time data and they can easily find problems early.
Reporting dashboard is also helpful for HR teams because they manage hiring, budget, attendance and payroll and all these things can be managed from one central view.