See Productivity in Real Time.
Monitor employee activity, track work hours, and improve team efficiency with powerful insights.
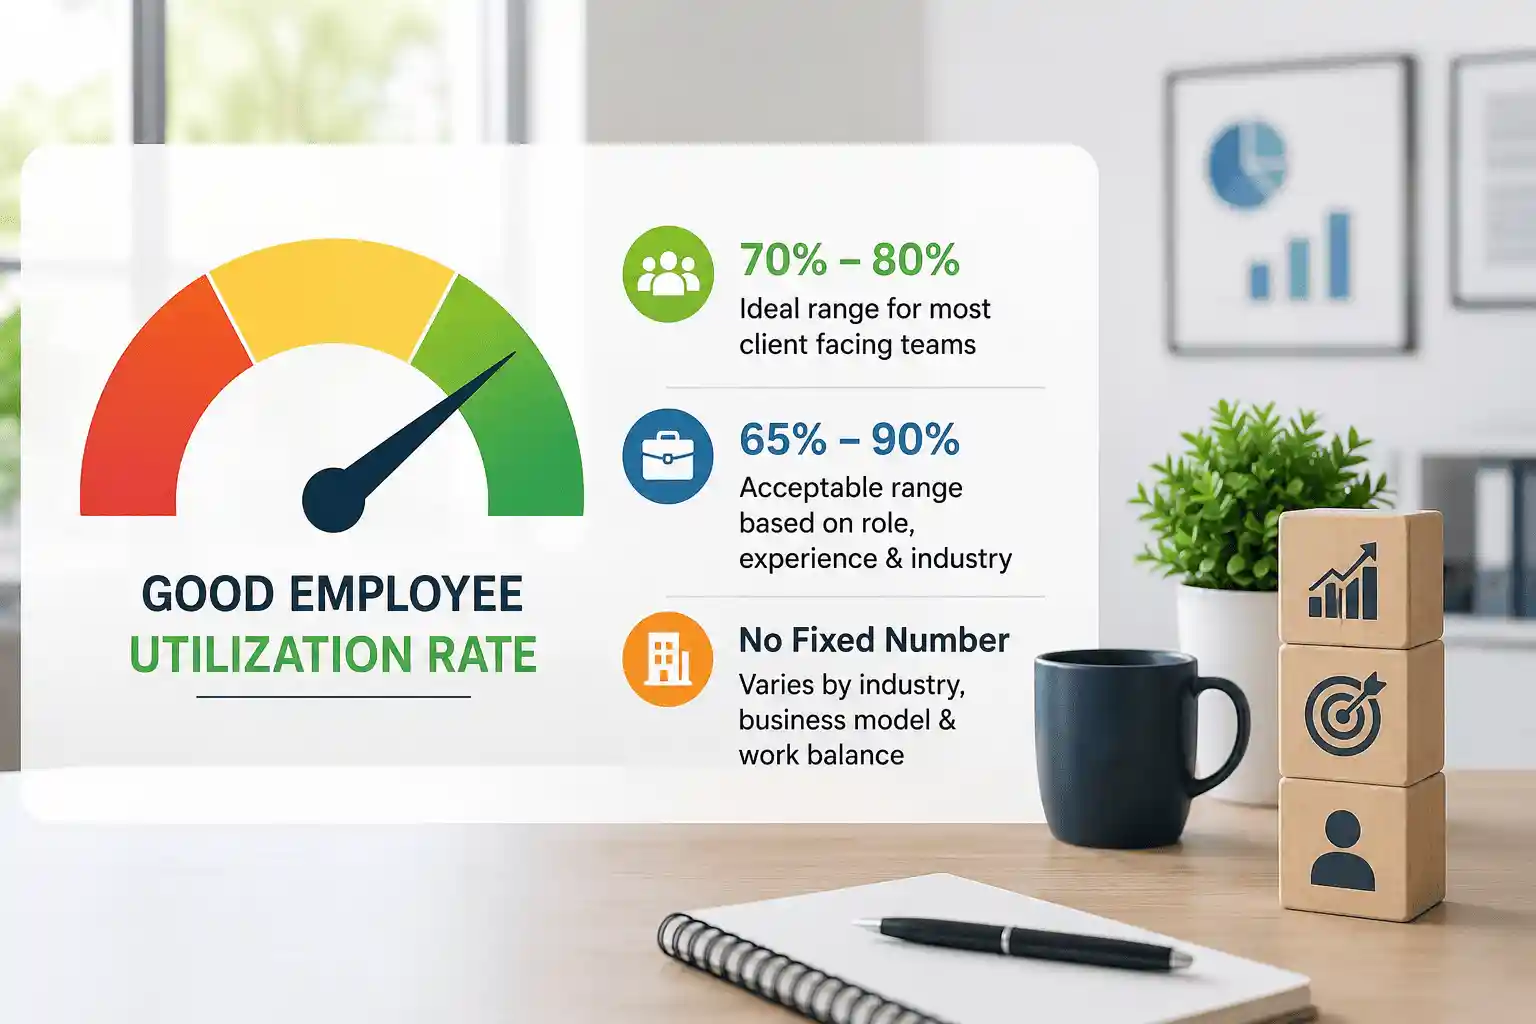
A good employee utilization rate usually between 70% and 80% for most client facing teams and 65% to 90% is acceptable according to the role, experience and industry standards. There is no fixed number that works for every industry and a software agency or BPO call center has different “good” rates because every business has different work balance and tasks.
If you are searching and understanding what employee utilization rate is and check whether the number is healthy or not then there is no correct number because 60% is low for revenue-driven teams but for management teams it is considered normal. 70% is the safe number which is considered good for every industry, 80% is considered strong performance.
Let us understand what the factors behind this are and how you can target your business for success without copying other company benchmarks.
What Is Considered a Good Employee Utilization Rate?
Employee utilization rate means how employees stay productive, billable and revenue-generating work in working hours.
You can use this simple formula.
Utilization rate = billable or productive hours ÷ total revenue-generating hours × 100
If an employee works 160 hours in a month and employee spends 120 hours for client work then utilization rate is considered 75%
According to most industry reports, a good employee utilization rate is generally between 70% and 80%. If the rate is below 65% then you may be paying for unused employee capacity or facing poor project planning. If the rate stays above 90% for a long time then employees may become overworked and the risk of burnout may increase.
There is no fixed employee utilization rate because utilization rate depends on two factors like how work is planned properly and how much time employees take to work properly.
Good Utilization Rate for Different Types of Employees?
You should apply the same utilization rate for every employee in the company because rates change based on seniority.
- Interns and entry-level staff
85% to 90% utilization rate is common because their work is already defined.
- Mid-level employees and individual contributors
75% to 85% utilization rate is typical, it maintains a balance between focused output and internal collaboration.
- Senior specialists and team leads
65% to 75% is realistic because employees spend their time on mentoring, work review and problem solving which are not directly billed,
- Managers and directors
50% to 65% is considered normal and expected because their time is not only directly used to improve output, they have an important role in planning, hiring, coaching and strategy.
If you are ignoring their role and expect the same utilization rate then you may penalize experienced employees and their responsibilities which are actually an important part of any company.
Good Employee Utilization Rate by Industry
The industry also affects utilization benchmarks because each industry has a different balance between billable work and other tasks.
- Consulting and professional services
Many firms consider around 75% a suitable level for balancing profitability and employee well-being.
- Creative and marketing agencies
The teams regularly spend time on ideas, planning, and meetings and other task which are not billable so their utilization is always lower.
- IT services and software teams
70% to 80% is very common because employees have enough time for coding, planning and fixing the technical mistakes and doing other things that are not billable.
- Manufacturing
80% to 85% is generally considered good because machines and employees are busy without putting extra pressure.
- Contact centers and support teams
80% to 90% is good because their work is easy and repetitive.
- Retail and hospitality
40% to 60% because customers change every day and employees spend more time on stocking, cleaning and training.
If you are running a company with different departments it is better to set their utilization rate according to their functions.
What Should Your Employee Utilization Target Be?
You set the utilization rate according to these questions instead of copying other company benchmarks
1- What does “productive time” actually mean this role?
Clearly define which work is billable or output driven and which count as for meeting or training
2- How much buffer does the role realistically need?
An employee who works for a client may be able to stay around 80% but roles involving problem-solving, checking work and managing other work need more time for these tasks.
3- What is your current baseline?
Before setting a target you should see actual data for 3 to 6 months. If your team stays on average approx. 50% to 55% then giving an 80% target then employees may become burned out, so you have to increase it slowly.
How to Know If Your Current Utilization Rate Is Healthy
Seeing a number is not the complete picture, you should check the percentage with other signs.
- Trend direction
When utilization rate is rapidly increasing from the last 6 months this shows better planning but if you see a sudden spike then this is the signal of understaffing.
- Consistency across the team
Some employees maintain a consistent 90+ utilization rate and some employees are at 50% then this is a signal that workload is not properly distributed.
- Overtime and unused leave
If overtime increases with utilization rate then it is not an increase in productivity, it is a sign of burnout.
- Quality of output
If utilization is good but continues to miss deadlines and find repeated complaints from clients then it means employees are working more than decided working but the quality of work suffers.
How to Track Employee Utilization Rate With WorkDesQ
Calculating utilization rate for a 5 person team is manageable but if you are handling multiple departments and locations it may be difficult to manage. This is where WorkDesQ is useful.
WorkDesQ helps managers to get real time work visibility and gives data on how employees actually spend their working hours.
- Providing data of active and idle time tracking
- You can see actual total working hours without calculating manually
- It reduces guesswork because WorkDesQ software provides actual work data
- See clear visibility productive employees and non-productive employees
- you can generate reports of overtime, productivity and attendance easily
Before setting employee utilization rate you can check the actual work pattern of employees and find who needs support and training.
Know How Your Team Spends Work Hours With WorkDesQ
How to Improve a Low Employee Utilization Rate
If your employee utilization rate is below the expected level then you should manage common issues.
Fixed project scoping and handoffs
The big reason for the low utilization rate is not to stay idle intentionally, it can happen when they are waiting for approval and unclear about what needs to be done.
Reduce meeting load
Review meetings quarterly because unnecessary scheduled meeting time reduces productive time approximately 20% to 30%.
Rebalance the workload across the team
You can use utilization rate to identify who is overworked and which employees have available capacity then share the workload accordingly.
Automate repetitive admin work
Manual reports, timesheets, and status updates take a lot of time. Instead of doing all these tasks manually, you can use WorkDesQ to automate them and save time.
Improve forecasting and staffing
If utilization is regularly low then it might be because the company is overstaffed. This may not be a productivity problem, it could be a resourcing issue.
Conclusion
A good employee utilization rate generally approximately 70% to 85% and it also depends on the industry and role. For most client-facing teams it is usually reliable around 75% and junior roles can maintain a higher rate or for senior roles like management can have a lower rate and it is normal.
You should set the utilization rate according to your company needs and work styles or based on projects, do not copy other company utilization rates. Do not ignore employee feedback, output quality and overtime trends.