All HR professionals face the challenge of creating productivity reports in Excel as these reports are essential for any company. They help identify which employees have performed well and which have not and these reports need to be generated at the end of every month.
Excel is a powerful tool used in all companies for various tasks. HR departments mostly use it for productivity tracking. We understand you might face difficulties with this we will explain how to create productivity reports in Excel and also tell you how to create productivity reports in Excel without using manual methods.
Why Use Excel for Productivity Reports
- Excel is available to everyone and is already installed on most laptops and computers
- You can create separate tabs for each employee.
- You can also draw charts and graphs to understand productivity reports
- You can easily share it with anyone via email or cloud storage
Key Metrics to Include in Your Report
When you create a productivity report in Excel it is only useful if you’ve included all the necessary points.
- Employee name or ID
- Task name
- Task Completion Rate
- Efficiency
- Comments
If you do not include all these points in your Excel report your productivity report won’t be understandable to anyone and no decisions can be made based on the report.
Create a Productivity Report in Excel (Step-by-Step)
Whenever you create a report in Excel you need to follow certain steps and you must follow these steps carefully. Now we will tell you what those steps are.
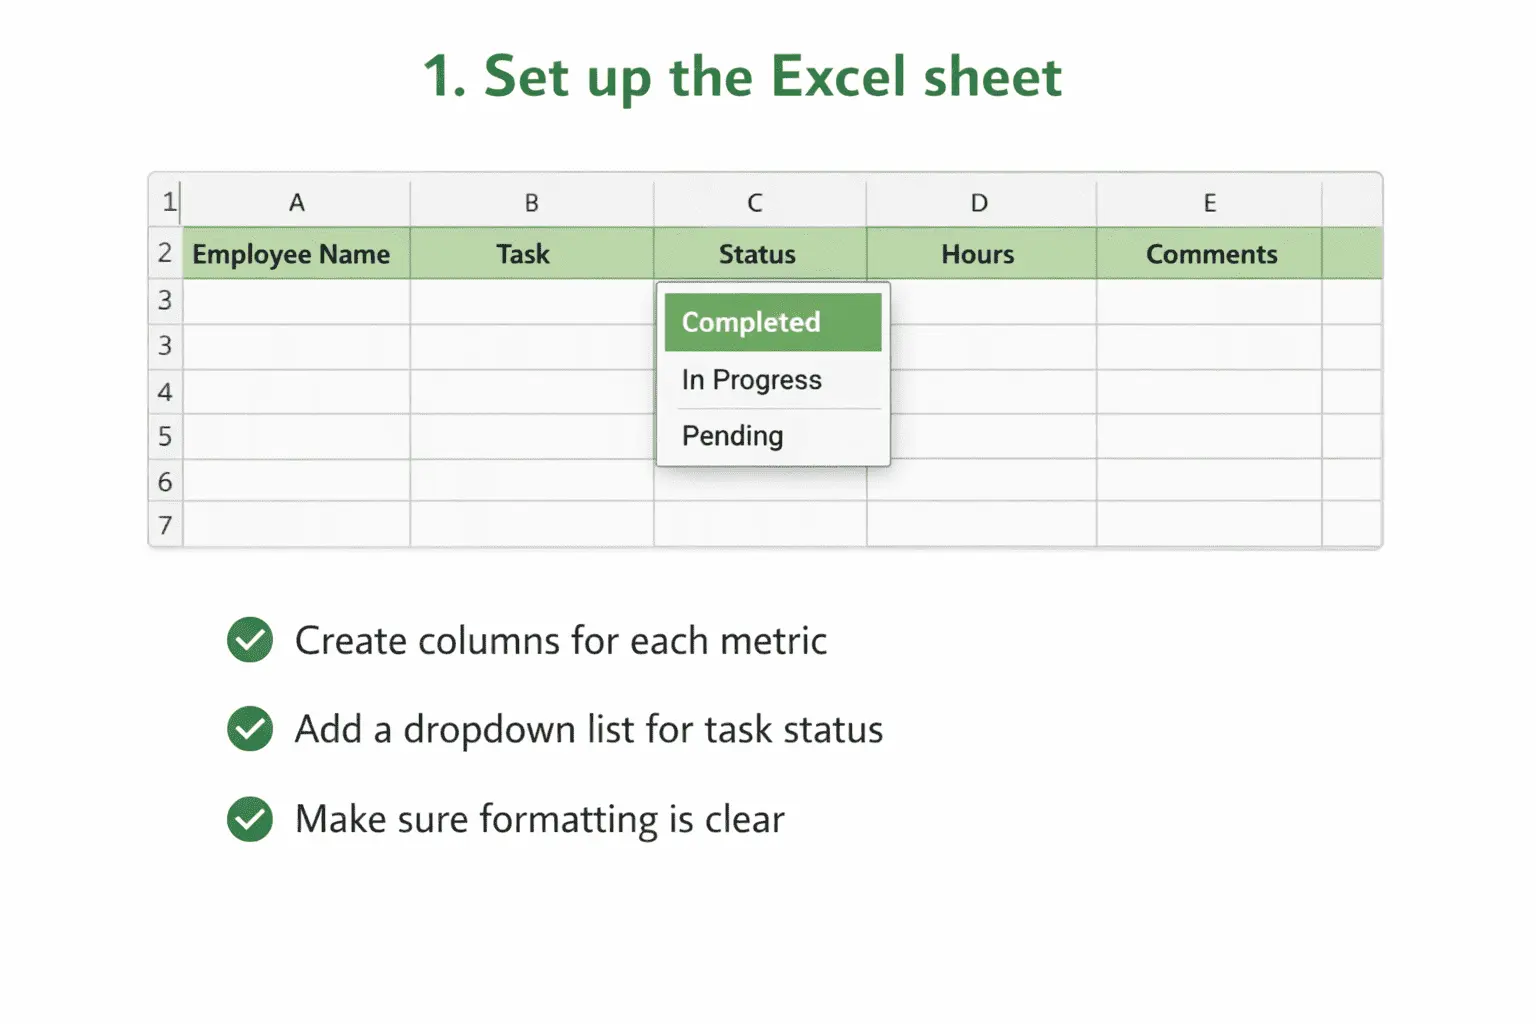
- Set up the Excel sheet
- In this step, you need to open Excel and create columns for each metric
- You also need to create a dropdown list where you will mention the task status, such as (completed/in progress/pending)
- You must ensure that your formatting is clean and readable
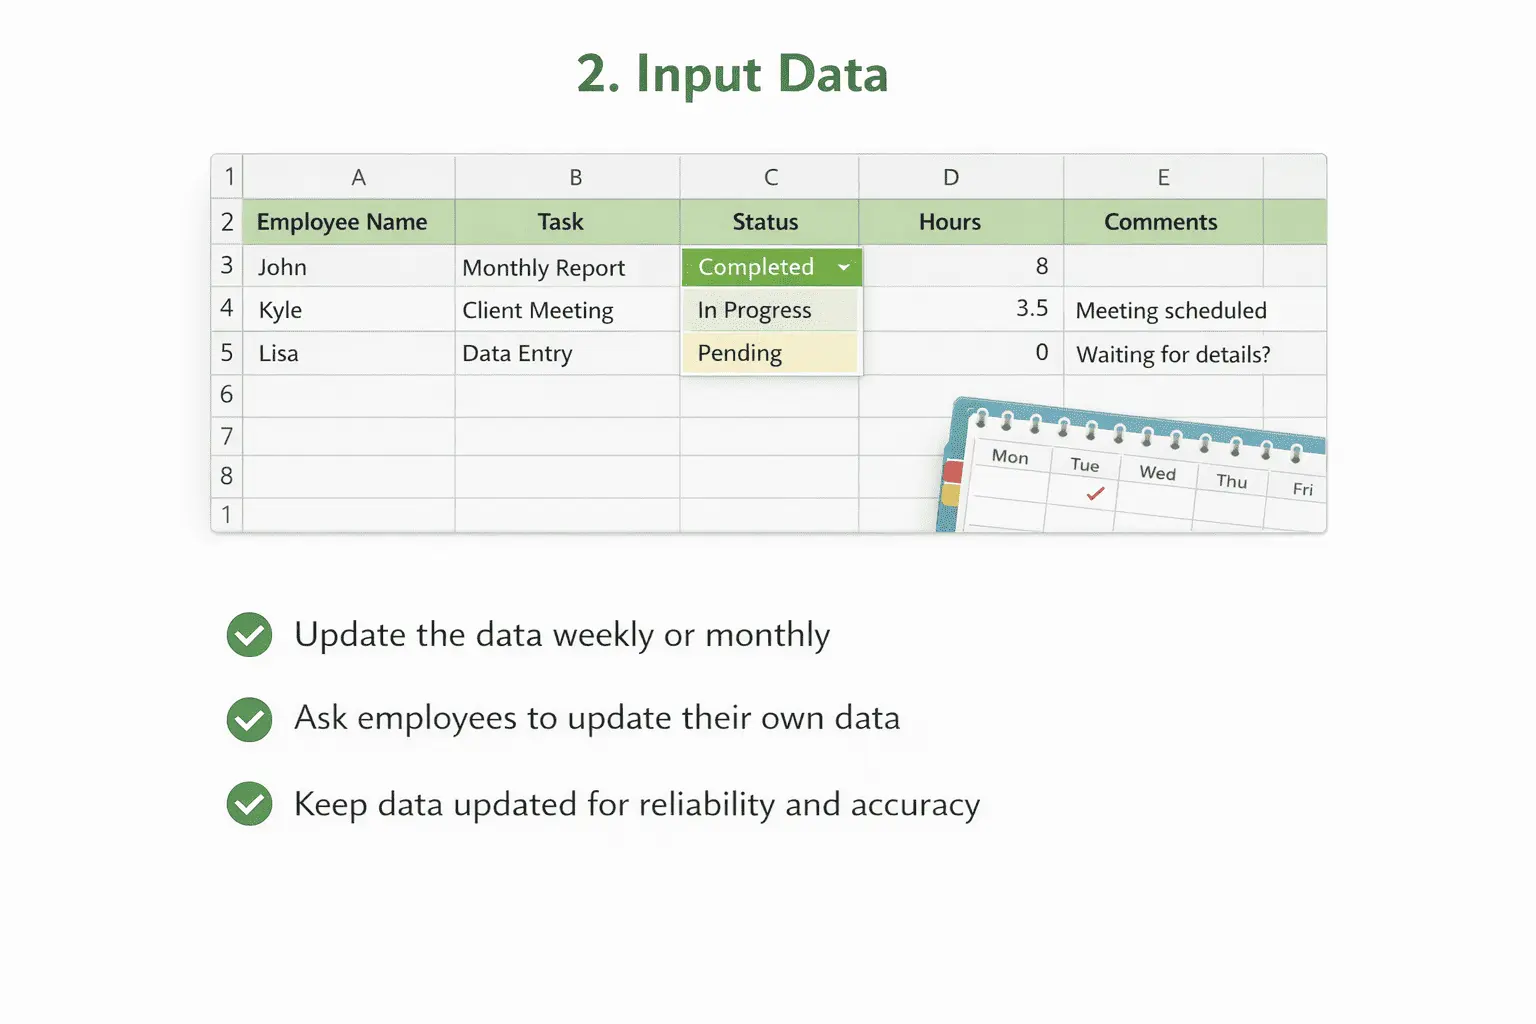
- Input Data
- Once you have filled in all the important details you should update the data weekly or monthly
- You can also try asking your employees to update their own data, which will make things easier for you
- The data will only be reliable if it is updated regularly because if even one day’s data is not updated the information will become incorrect
- Add Formulas for Automatic Calculations
- Excel has many complex formulas that can be used to filter data, but it also includes some basic formulas that can be very useful when creating productivity reports.
- Total Work Hours
(=SUM(B2:B10))
- Task Completion %
(COUNTIF(StatusRange,”Completed”)/TotalTasks*100)
- Conditional Formatting
Highlight productivity below 70% in red
With these formulas, you can easily calculate and understand the data, and filter it with minimal effort.
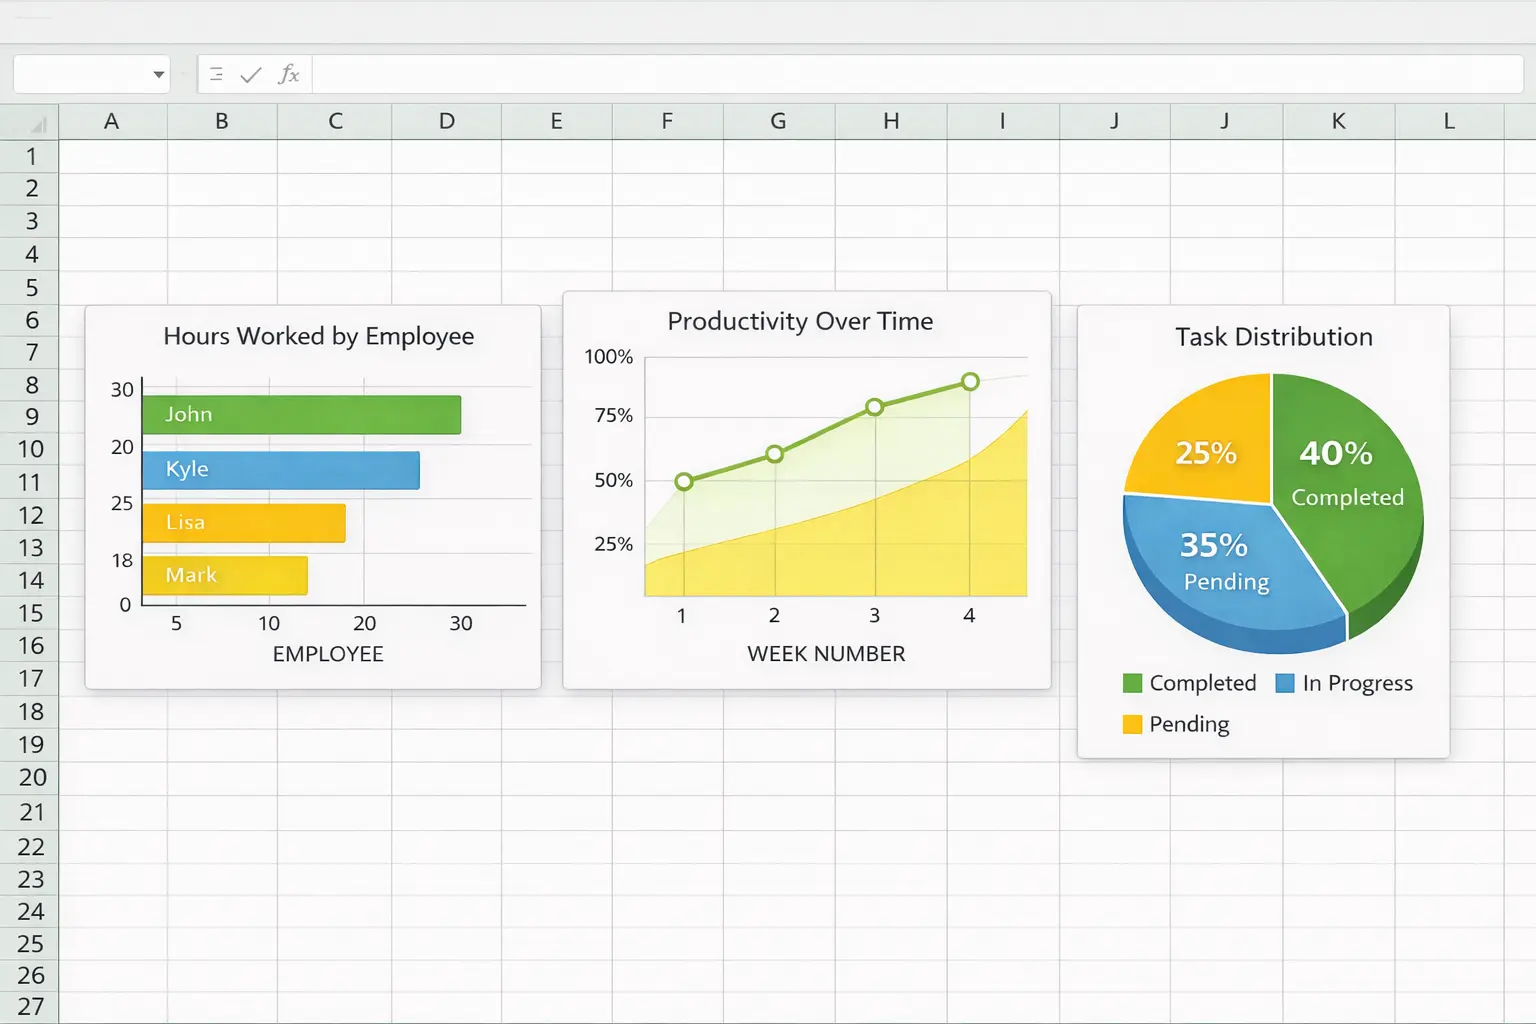
- Create Visualizations
This is an important step in creating an Excel report format because it’s the only step that allows even a layperson to easily understand the report.
- You can create and display bar charts, task completion charts, and charts showing the number of hours each employee worked
- You can also create line graphs to see when employees were productive and when they weren’t
- Create a pie chart, which will make it easier for you to understand how many employees are working on each task
Managers also review these reports because they want to know how their team is performing. This is a crucial step in creating productivity reports in Excel.
- Save as Template
Once you have created all the reports in Excel, you will need to save the reports as a template so that you don’t have to create the basic metrics again in the future.
- File → Save As → Excel Template (.xltx)
- This allows you to easily reuse it every week or month
- Optional: Protect the sheet to avoid accidental edits
Best Practices for Productivity Reports in Excel
Whenever you create productivity reports in Excel, keep the reports very simple so that anyone can easily understand them. Always keep the reports updated so that you can understand the productivity trends. You can do this monthly or weekly.
Whenever you check data in Excel always create a section for site notes or comments so that you know what you need to say to each employee. Always keep your Excel sheet password protected because it includes personal employee details. Keep one copy of the file on your laptop and another copy on a cloud storage drive.
Common Excel Productivity Mistakes
When Excel reports are created, some mistakes often occur.
- Overloading Data
In an attempt to create detailed reports, you end up entering a lot of employee information into Excel, which makes the data in the spreadsheet quite complex.
- Irregular Updates
You start updating the reports whenever you feel like it, but that’s not the right approach. You should always update the data according to a schedule.
- Manual Calculation
People do manual calculations in Excel which leads to mistakes. You should always use formulas to avoid mistakes.
Switching from Manual to Software Based Reports
We tried our best to help you solve your problem of creating productivity reports in Excel but when you have a very large team of employees like 5,000 to 10,000 employees and you creating a productivity report in an Excel sheet becomes almost impossible.
What do you do then? We have the answer to this question: use our WorkDesQ productivity tracking software which will provide you with all employee data in Excel with just one click. Isn’t that easy? For more information you can contact our support team.
Conclusion on Productivity Report in Excel
If you have a small team, this information will be helpful for you because many small companies maintain productivity reports in Excel, and many HR professionals face problems with this. Our blog will solve this problem for you; you just need to follow a few steps.
If you have a large team, you can definitely opt for our software-based solutions where you won’t need to do any manual work.